How to Draw Interactive 3D Property Boundaries on Maps

Maps are no longer limited to simple location pins and flat property outlines. Interactive 3D property boundaries are changing the way land parcels, real estate projects, and infrastructure layouts are visualized online. By adding depth and interactivity to maps, users can better understand property dimensions, project extents, and surrounding spaces in a much more intuitive way.
From real estate listings to urban planning projects, 3D boundary visualization helps convert static geographic information into a more engaging spatial experience.
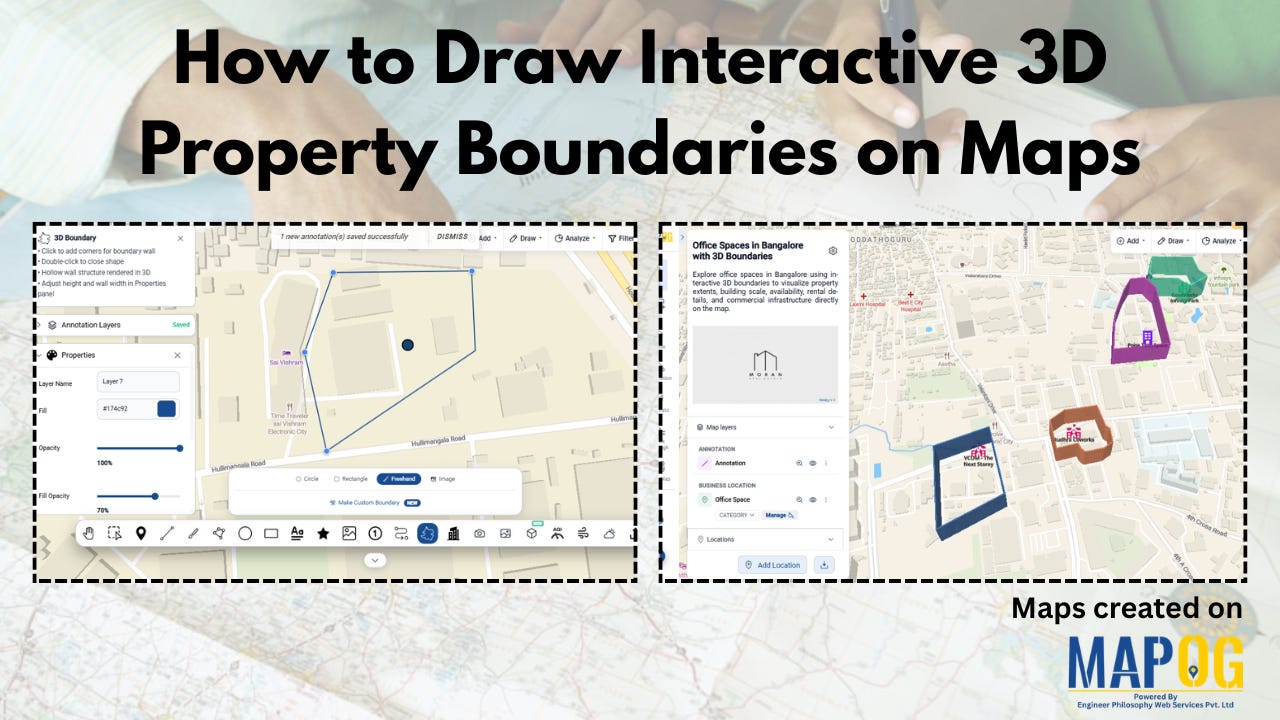
What Are Interactive 3D Property Boundaries?
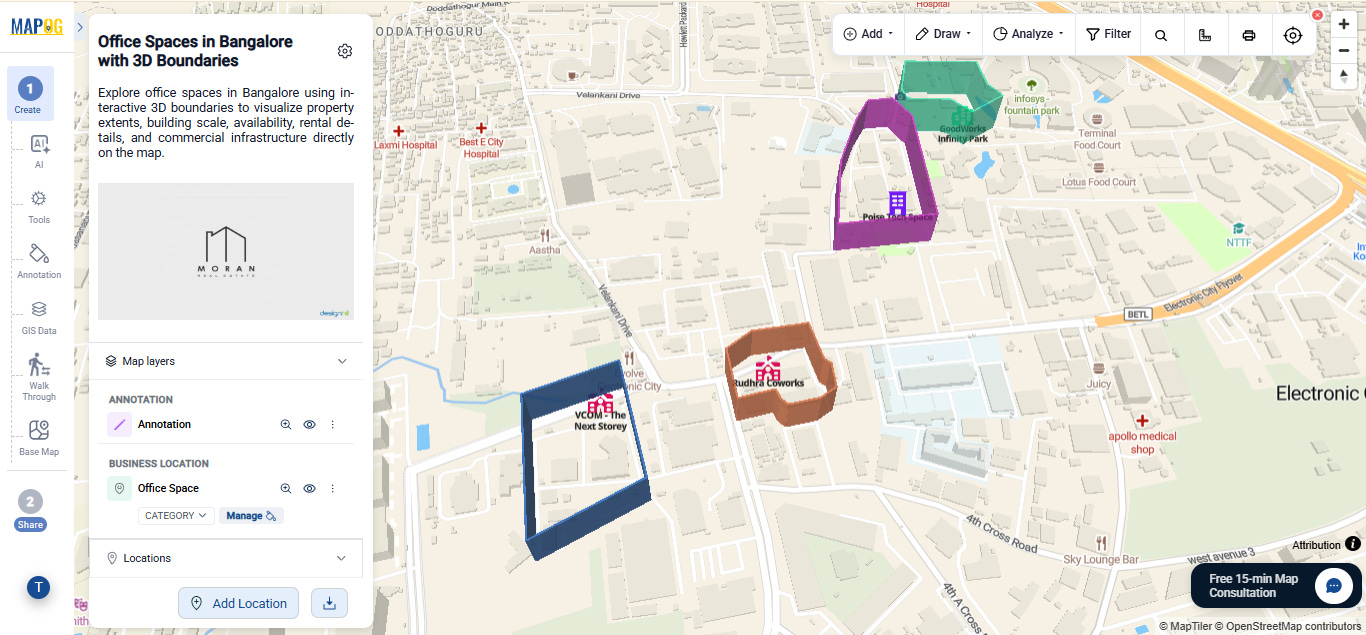
Interactive 3D property boundaries are polygon-based map layers that visually represent the shape and extent of a property with added height or elevation effects. Instead of displaying a simple flat outline, the property appears as a raised or highlighted area on the map, making it easier to identify and explore.
These boundaries can also include interactive information such as:
Property details
Plot dimensions
Ownership or zoning data
Project status
Images or descriptions
This combination of spatial visualization and interactive data creates a more immersive map experience.
Why Are They Useful?
3D property boundaries improve map readability and make geographic information easier to interpret, especially for larger projects or multi-property layouts.
Common Benefits
Better understanding of property layouts
Improved visual presentation for clients
Easier comparison between plots or zones
Enhanced planning and decision-making
More engaging website and dashboard integration
They are especially valuable in industries where location clarity and spatial context are important.
How 3D Property Boundaries Are Created
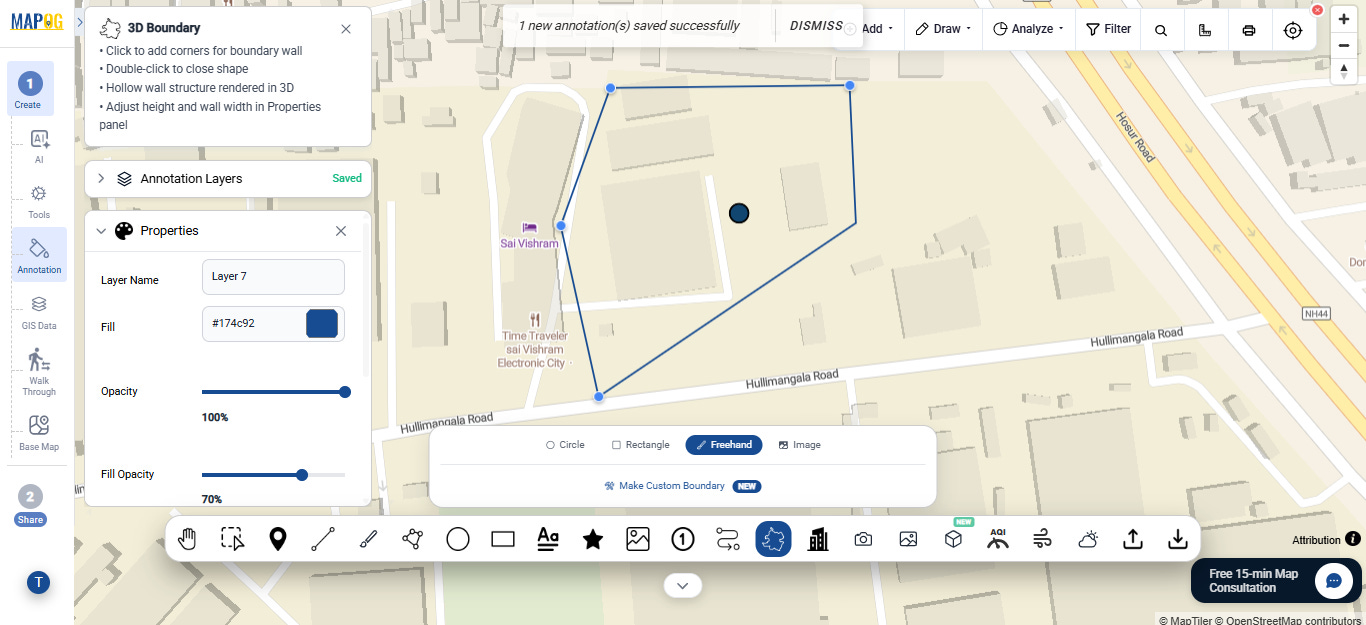
The process usually begins with collecting accurate property coordinates or survey boundary points. These coordinates are used to create polygon shapes on a digital map. Once the polygon is created, elevation or extrusion effects are applied to generate the 3D appearance.
Typical Workflow
Collect property coordinates
Create polygon boundaries
Add property attributes and labels
Apply 3D visualization effects
Enable map interactivity and filters
Additional datasets such as satellite imagery, terrain layers, or infrastructure data can also be added to improve visualization quality.
Tools Used for Interactive Property Mapping
Several modern mapping platforms now support interactive polygon visualization and 3D map rendering. Platforms such as MAPOG allow users to draw property boundaries, upload location data through CSV files, customize layers, and create interactive map experiences without complex GIS workflows.
Features Often Available
Polygon drawing and editing
CSV-based bulk location uploads
Interactive property layers
Custom map styling
Website embedding support
These tools are increasingly being used for real estate showcasing, land management, construction planning, and infrastructure visualization.
Where This Is Being Used
Interactive 3D property boundaries are now being adopted across multiple industries because they simplify spatial communication and improve how geographic information is presented.
Real-World Applications
Real estate and plotted developments
Urban planning and smart city projects
Construction site visualization
Infrastructure and utility mapping
Tourism campuses and resort layouts
As mapping technology becomes more interactive, 3D visualization is becoming a standard feature for presenting location-based information.
Conclusion
Interactive 3D property boundaries make maps more than just navigation tools. They help users visualize land, understand spatial relationships, and interact with property information in a more engaging way. Whether used for planning, management, or presentation, 3D property visualization is becoming an essential part of modern digital mapping workflows.